Floods
 |
|
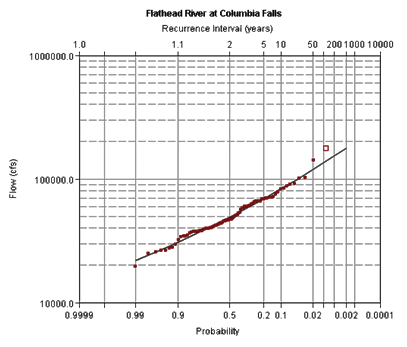
| Figure 1.5: Flathead River at Columbia Falls Flow/Probability. Source: Craig Kendall, Flathead National Forest |
|
| click to enlarge |
|
Floods are natural events for rivers and streams as excess snowmelt and rainwater accumulates and overflows onto riverbanks and bordering floodplains. Floods occur annually in low-lying areas, though the severity of flooding is determined by the quantity of snowpack in winter and the subsequent rain in the spring. In the spring Chinook winds – warm dry winds with gusts up to 100 mph (161 kmph) – can occur, rapidly melting snow in the mountains and consequently flooding valleys.
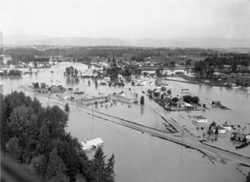
Although there are no detailed records, old-timers of the Flathead refer to the 1894 flood as the largest in the Flathead Watershed. The largest flood on record occurred in early June of 1964, when the Flathead River crested at 26.5 feet (8.07 m), over 12 feet (3.7 m) above flood stage. The flood appears as a red square in Figure 1.5. This flood was the result of a warm air mass from the Gulf of Mexico that entered the watershed from the southeast. Heavy rains fell on a deep snow pack in Glacier National Park, the Middle Fork, South Fork, and portions of the North Fork drainages, rapidly melting it. This catastrophic flood destroyed several sections of highway and rail lines along the Middle Fork and sent McDonald Creek, a tributary to Lake McDonald in Glacier National Park running upstream. It inundated 20,000 acres (8,000 hectares) of land in the Flathead Valley, flooded several hundred homes, and damaged pipelines and bridges. Areas as far as one mile (1.6 km) from the river were inundated under four feet (1.2 m) of water. One of the hardest hit areas was Evergreen (Figure 1.7).
Unfortunately, extensive development has taken place on some of the land most susceptible to flooding, and where the worst flooding has occurred in the past. A flood of the 1964 magnitude today would affect a number of businesses built since then including Snappy’s, Kmart, Wal-Mart, Super 1, and numerous others along U.S. Hwy 2. The same amount of floodwater would be devastating to these enterprises and the many private residences that have also been built in the area. About 6,000 parcels of land—not all developed yet—are now located in the special flood hazard area known as the 100-year floodplain.
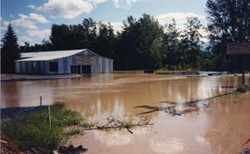
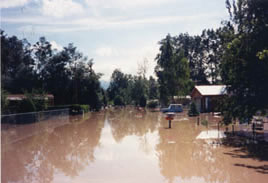
Though not as drastic as the 1964 flood, extensive flooding has occurred in the Flathead Watershed during several years, including 1974, 1975, 1991, 1995 (Figure 1.8), 1996, and 1997. In 1997, the wettest year in Flathead Valley history, the Swan and Stillwater rivers experienced 100-year floods. Montana Highway 35 near Woods Bay was submerged, as were parts of Evergreen, and the Echo Lake Causeway road.
Floods are important to understand because they pose a threat to life, property, and the infrastructure of communities. In addition to the risks associated with locating businesses and homes in the floodplain, development itself also changes the floodplain and the movement of floodwater. With every home and building, topsoil is disturbed and moved, potentially lowering the level of the land and increasing the potential for flooding. Extensive impermeable asphalt surfaces such as parking lots have replaced natural ground that once allowed water to percolate down from the land. New buildings and walls, and the debris left behind by their development become obstacles or dams for water moving along its natural course. Even clogged culverts can stop water from flowing away from parking lots and driveways. It is difficult to know how the movement of water in the next 100-year flood will be affected by the many changes that have occurred in the Flathead Watershed over the past decades.
 |
 |
| Figure 1.7: 1964 Evergreen Floods. Source: Flathead Planning & Zoning | |
  |
|
| Figure 1.8: 1995 Evergreen Floods. Source: Flathead Planning & Zoning | |
Flooding Effects on Flathead Lake
As a natural freshwater lake, Flathead Lake reduces the flow of the river below the lake. The highest flow on record at the river gauging station at Polson was 82,100 cubic feet (2325 m3) per second on May 28 & 29, 1928, only half of the flow of the river at Columbia Falls during the flood of 1964. Inflows to Flathead Lake are partially regulated by Hungry Horse Dam, located on the South Fork of the Flathead River. Flathead Lake’s surface elevation is regulated by Kerr Dam, located on the Flathead River approximately 4.5 miles (7.24 km) below the lake’s outlet.
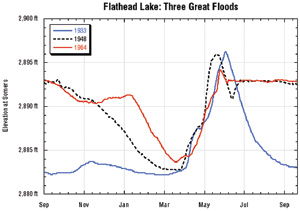 |
Figure 1.9: Three Floods Hydrograph. Source: Flathead Lakers |
The Flathead River flood of 1933 was the last great flood before Kerr Dam was built. The hydrograph in Figure 1.9 is natural, with a peak in early June. The flood of 1948 was the last great flood after the completion of Kerr Dam and before Hungry Horse Dam was built. Hungry Horse impounds the South Fork of the Flathead, controlling approximately 30% of the inflow to Flathead Lake. The hydrograph is no longer natural as a result of the dams, and the drawdown from October through April is fairly steady. The flood of 1964 occurred a decade after Hungry Horse dam began operating, producing the highest river peak on record. Although this was the highest crest on the river, it did not produce the highest peak on the lake because the duration of the flood was shorter and the total volume of water less than in 1933 or 1948.
Analyzing Flooding
Craig Kendall, Flathead National Forest
The rivers in the Flathead Watershed start to rise in the spring as snow begins to melt in the mountains. As the water rises, it begins to approach the bankfull discharge—the flow needed to fill a river channel to the top of its banks. This is the elevation where water begins to flow onto the active floodplain. The dimensions of most rivers are the direct result of the bankfull discharge. Hydrologists generally consider the bankfull discharge as the effective discharge—the discharge that moves the most sediment over time. The bankfull discharge forms the basic channel dimensions, moves and forms bars, and forms the basic meander geometry of the river over time. Meander is the bend formed when a river erodes its outer banks widening its valley. Frequency analysis is a method that hydrologists use to estimate the probability of (p) that a flood of specific size might occur in any given year. A recurrence interval (RI) is the estimated time between floods of the same size. The probability of a flood and its recurrence interval are related to each other based on the formula:
RI = 1/p
For example, the probability that a 100 year flood will occur in the Flathead River this year is 0.01 or 1%. Similarly, there is a 50% chance (p equals 0.5) that a 2 year flood could occur this year. In order to conduct a frequency analysis for yearly floods, annual peak discharge values are gathered from a gaging station. The annual peak discharge is the highest flow recorded for each year. Then the numbers are ranked from the highest to the lowest. Once the discharge values are ranked, their probabilities are estimated using the formula below.
p = M/(N+1)
Where (p) equals the probability, (m) is the rank of the flood in relation to the others on record, and N = the number of records. For example, the probability of the largest flood occurring (m equals 1) at a gage with 49 years of record would be estimated at 1/50 or 0.02. Once the probabilities are estimated, they are plotted and a line is fitted to the points using specialized statistical techniques. The points are usually plotted on logarithmic scales so that they appear in a straight line. This allows for easier interpretation of the data. An example flood frequency plot for the Flathead River at Columbia Falls is shown in Figure 1.5.

